Published in: D. Behrend and A. Rius (eds.):
Proceedings of the 15th Working Meeting on European VLBI
for Geodesy and Astrometry,
Institut d'Estudis Espacials de Catalunya,
Consejo Superior de Investigaciones Científicas,
Barcelona, Spain, 2001.
ITRF2000 Positions of Non-geodetic Telescopes in
the European VLBI Network
|
Patrick Charlot(1), Robert Campbell(2),
Walter Alef(3), Kazimierz Borkowski(4),
John Conway(5), Anthony Foley(6),
Simon Garrington(7), Alexander Kraus(3),
Axel Nothnagel(8), Ojars Sovers(9),
Corrado Trigilio(10), Tiziana Venturi(11),
Huang Xinyong(12)
|
(1)Observatoire de Bordeaux — CNRS/UMR 5804;
(2)Joint Institute for VLBI in Europe;
(3)Max-Planck-Institut für Radioastronomie;
(4)Nicolaus Copernicus University, Torun Centre for Astronomy;
(5)Onsala Space Observatory;
(6)Netherlands Foundation for Research in Astronomy;
(7)MERLIN/VLBI National Facility, Jodrell Bank Observatory;
(8)Geodetic Institute of the University of Bonn;
(9)Remote Sensing Analysis Systems, Inc. — Jet Propulsion Laboratory;
(10)Instituto di Radioastronomia, Stazione VLBI Noto;
(11)Instituto di Radioastronomia, CNR;
(12)Shanghai Observatory, Chinese Academy of Sciences
|
Abstract:
The European VLBI Network (EVN) has conducted a dedicated non-standard
geodetic VLBI experiment in November 2000 with the goal of improving the
positions of three non-geodetic EVN telescopes (Jodrell Bank, Torun,
Westerbork). The positions of these telescopes were previously known to
a few meters only, which is not sufficient for accurate processing of VLBI
experiments conducted in phase-referencing mode. The observing frequency
was 5 GHz, the highest common frequency available at all telescopes.
Observations and data analysis are discussed with special emphasis on the
effects of the ionosphere, the dominating error source in this
single-frequency experiment. Assessment of the quality of the results
indicates that the new estimated telescope positions are accurate to
about 5 cm.
|
|
The European VLBI Network (EVN) is an array of radio telescopes![[*]](Charlot-foot_motif.gif) spread throughout Europe and Asia, which conducts VLBI observations of radio
sources, generally for astrophysical purposes. Some of these telescopes also
participate regularly in dual-frequency (S- and X-band) geodetic campaigns
[1], and thus have highly-accurate geodetic positions. By contrast,
some other EVN telescopes, not equipped with S/X radio receivers, have poorly
known positions because they have never participated in such campaigns. The
major telescopes in the latter category are located at Jodrell Bank (United
Kingdom), Torun (Poland) and Westerbork (Netherlands).
spread throughout Europe and Asia, which conducts VLBI observations of radio
sources, generally for astrophysical purposes. Some of these telescopes also
participate regularly in dual-frequency (S- and X-band) geodetic campaigns
[1], and thus have highly-accurate geodetic positions. By contrast,
some other EVN telescopes, not equipped with S/X radio receivers, have poorly
known positions because they have never participated in such campaigns. The
major telescopes in the latter category are located at Jodrell Bank (United
Kingdom), Torun (Poland) and Westerbork (Netherlands).
Inaccuracy in the terrestrial coordinates of the above antennas has been a
major limitation for EVN observations with the phase-referencing technique.
This technique, now commonly used for imaging weak radio sources, alternates
observations between a target source and a nearby calibrator, and requires
accurate knowledge of the VLBI geometrical model to be successful [2].
To overcome this situation, a dedicated geodetic VLBI experiment was carried
out by the EVN in November 2000, with the aim of improving those poorly known
telescope positions. The following sections present the design of this
non-standard geodetic experiment, the data analysis scheme, and the results
of these observations. The accuracy of the new estimated telescope positions
is discussed in Section 5.
Observations were carried out during a 24-hour period starting at 9:30 UT on
November 23, 2000, with a network consisting of four geodetic telescopes
(Effelsberg, Medicina, Noto, Shanghai) and five non-geodetic telescopes
located at Cambridge, Jodrell Bank, Onsala, Torun, and Westerbork. An
additional geodetic antenna (Urumqi) was scheduled but could not observe
because of technical problems. At Jodrell Bank, the Mk2 telescope was used,
while at Onsala, the 25 m antenna (Onsala85) was employed. The option of
observing with a single telescope (antenna 7) at Westerbork was preferred to
using the phased-array because the effective phase centre of the array (and
therefore the geodetic position) might vary when the array configuration is
changed, for example if some antennas are switched in or out of the array.
Unlike standard dual-frequency geodetic observations, this experiment was
carried out at the single frequency of 5 GHz, the highest frequency available
at all observing telescopes. A specific bandwidth synthesis scheme recording
8 frequency channels, each 8 MHz-wide, spread over 108 MHz was designed for
this experiment. This bandwidth was chosen based on the common frequency
range between telescope receivers which was about 120 MHz. The individual
channel frequencies were 4906.99, 4909.99, 4918.99, 4936.99, 4969.99, 4993.99,
5008.99 and 5014.99 MHz. Data from the MERLIN telescope at Cambridge were
recorded at Jodrell Bank via a 200-km 28-MHz microwave link and thus had
only a limited bandwidth. Due to this mode of transmission, path length
variations between Cambridge and Jodrell Bank could not be measured and
removed from the VLBI data in the standard automatic way.
Scheduling was carried out with the NASA SKED program in order to optimize
the sky coverage at each telescope as in standard geodetic experiments. A
total of 20 strong sources selected from the International Celestial Reference
frame (ICRF) catalog [3], well spread in right ascension and between
–25° and
80° declination, was observed for this purpose with
generally 5 to 15 scans on each of them. Integration times ranged from 1 to
6 min and were set to obtain signal to noise ratios larger than 100. Low
elevation observations (< 10°) were avoided to limit systematic
errors caused by the ionosphere.
The raw data bits were correlated with the Mark IV data processor in Bonn,
Germany, and exported through a geodetic data base file. Further analysis of
the bandwidth synthesis delay and delay rate was conducted with the MODEST
software [4] after converting the data into NGS format. The overall
analysis strategy aimed at fixing all ``known'' parameters of the VLBI model
to limit possible biases and systematic errors caused by improper knowledge
of the ionosphere, which is the dominant error at this relatively low observing
frequency.
Following this scheme, the coordinates of all extragalactic sources were held
fixed at their ICRF values. Similarly, the coordinates of the geodetic telescopes
were held fixed at their values in the International Terrestrial Reference Frame,
namely the ITRF2000. The coordinates of the non-geodetic antenna
Onsala85 were derived from those of the nearby geodetic antenna Onsala60 using
a local tie measured with X-band VLBI in the early 1980's [5] and were
also held fixed. The Earth orientation parameters were adopted from the IERS
combined series C04, which is consistent at the
sub-centimeter level with the above terrestrial and celestial reference
frames. In all, only clocks (using a time-linear model with breaks when
needed), tropospheric zenith delays (see below), and the coordinates of the
non-geodetic telescopes (except Onsala85) were estimated.
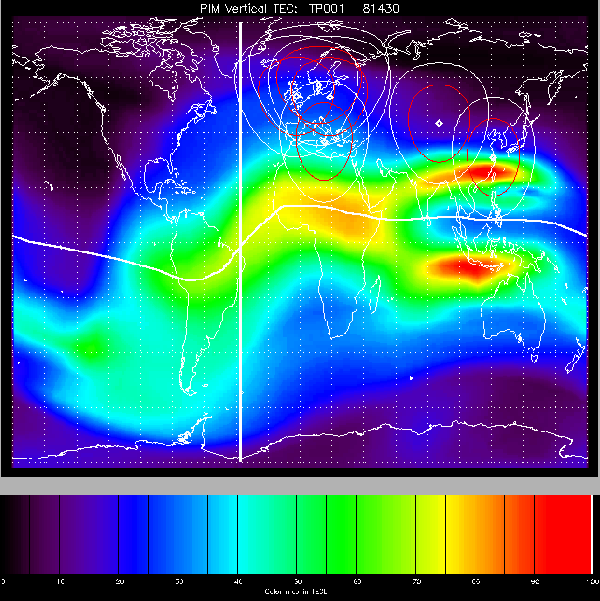
Figure 1:
Global ionospheric map showing the vertical TEC calculated by PIM
at 14:30 UT on November 23, 2000, with color scale in TEC units
(1 TECU=10
16electrons/m
2). The thick
vertical line indicates the longitude of the Sun, while the line orientated
East-West represents the magnetic equator. ``Circles'' around selected stations
show intersections of constant-elevation lines of sight
(0° for white circles, 30° for red circles) with an altitude of 500 km, representing
a maximal value for the height of the F
2-layer peak.
|
The troposphere was modeled using the Niell mapping function [6],
estimating one zenith tropospheric delay per station for the whole 24-hour
period with a priori values derived from meteorological measurements. This
scheme differs from that used in standard geodetic experiments where new
zenith troposperic delays are estimated at much shorter time intervals, but
was preferred for this specific dataset to limit the number of estimated
parameters. The ionosphere was modeled using the Parameterized Ionospheric
Model (PIM), which is a theoretical model of ionospheric climatology developed
at USAF Phillips Laboratory [7] and freely available. This model
determines the electron density at a given point of the ionosphere (defined
by latitude, longitude and height) as a function of local time, latitude,
season, solar activity, geomagnetic activity, and interplanetary
magnetic-field direction. Integration along a given direction then provides
the total electron content (TEC), which serves as the basis to calculate
the ionospheric delay. For our analysis, ionospheric delays were determined
directly along the lines of sight between the stations/observed sources using
a specific version of PIM developed for application to VLBI astrometry
[8], and added afterwards to the ionospheric-free VLBI model
implemented in MODEST. Figure 1 shows a global map of vertical TEC,
representative of the ionospheric morphology at 14:30 UT on the day of our
observations. Examination of similar maps at various times during the
experiment revealed that the ionosphere was relatively stable over Europe
on that day, but was significantly disturbed over the eastern part of China
where the Shanghai telescope is located (see Fig. 1).
Based on the above analysis and modeling, the post-fit rms residuals were
292 ps for delay with a χ2
per degree of freedom of 1.03, and 230 fs/s
for delay rate with a χ2 per degree of freedom of 1.05. The data from
two telescopes, Shanghai and Cambridge, have not been used in the analysis.
All baselines to Shanghai showed larger residuals, most probably caused by
ionospheric disturbances improperly modeled by PIM (see above). It was also
decided to discard the observations from Cambridge because this telescope
had usable data in only one frequency channel. This was, however, not a
major inconvenience for the project, since the coordinates of Cambridge
could be derived from those of Jodrell Bank by using estimates of the
Cambridge-Jodrell Bank baseline, measured to a few centimeter accuracy
from MERLIN observations of source pairs. Figure 2 shows the
rms delay residuals as a function of baseline length with a least-squares
linear fit to the data. There is a statistically-significant trend indicating
an increase of the residuals with baseline length, which is expected if
the ionosphere is the dominating error in the model. For short baselines,
mismodeling is attenuated because ionospheric variations are correlated at
nearby stations and partially cancel out when calculating the differential
delay contribution.
Figure 2:
Rms delay residuals (in ps) as a function of baseline length
(excluding baselines to Shanghai).
|
The estimated geodetic positions of Jodrell Bank, Torun, and Westerbork
derived from this analysis, are given in Table 1 together with
the shifts to the original coordinates (as previously available from the
station catalog of the SCHED scheduling software). These shifts are listed
for each telescope on the line immediately following its estimated coordinates.
For completeness, the coordinates and shifts of the non-geodetic antenna
Onsala85 are also listed, although these were not estimated in
the analysis (see above). One notes that the corrections to the original
coordinates of the four telescopes are as large as several meters. Uncertainties
in the individual coordinates (one-sigma error derived from the least-squares
fit) range from 1 to 3 cm, which is relatively small for such single-frequency
observations. To determine whether these are realistic, alternate analyses
estimating ``known'' parameters have been carried out, as described below.
Table 1:
Coordinates of four EVN telescopes in ITRF2000 (epoch 1997.0) and
shifts to original values.
| Telescope |
X (m) |
Y (m) |
Z (m) |
|
|
| Jodrell Bank |
3822846.76 ± 0.02 |
–153802.28 ± 0.01 |
5086285.90 ± 0.02 |
|
4.10 ± 0.02 |
–2.15 ± 0.01 |
–1.32 ± 0.02 |
| Torun |
3638558.51 ± 0.02 |
1221969.72 ± 0.01 |
5077036.76 ± 0.03 |
|
0.51 ± 0.02 |
2.72 ± 0.01 |
–4.24 ± 0.03 |
| Westerbork |
3828651.29 ± 0.02 |
443447.48 ± 0.01 |
5064921.57 ± 0.02 |
|
4.11 ± 0.02 |
–2.54 ± 0.01 |
–1.51 ± 0.02 |
| Onsala85 |
3370966.126 |
711465.954 |
5349664.023 |
| –2.055 |
1.037 |
–0.090 |
Validation of our analysis and results was first considered by estimating the
coordinates of the geodetic telescopes. For this purpose, four alternate analyses,
each estimating in turn the coordinates of one of the geodetic telescopes (including
Onsala85) in addition to those of the non-geodetic telescopes, have been carried
out. Results are given in Table 2 in terms of corrections to ITRF2000
coordinates. Since these coordinates are known to sub-centimeter accuracy, any
significant correction would have to be attributed to deficiencies of our analysis.
Table 2 shows that this is not the case since all estimated corrections
are within one-sigma error. This is an indication that our derived uncertainties,
although relatively small, are probably realistic.
Table 2:
Estimated corrections to ITRF2000 coordinates of EVN telescopes at geodetic
sites.
| Telescope |
ΔX (m) |
ΔY (m) |
ΔZ (m) |
|
|
| Effelsberg |
0.00 ± 0.02 |
0.00 ± 0.01 |
–0.01 ± 0.03 |
| Medicina |
–0.02 ± 0.03 |
0.01 ± 0.01 |
0.03 ± 0.03 |
| Noto |
–0.01 ± 0.03 |
0.00 ± 0.01 |
–0.02 ± 0.02 |
| Onsala85 |
0.00 ± 0.02 |
–0.01 ± 0.01 |
–0.03 ± 0.03 |
An additional test consisted in estimating the telescope axis offsets.
Again, these should be known to centimeter accuracy and no significant
deviations should be found. For this test, a single analysis estimating
the axis offsets of all telescopes together with the coordinates of the
non-geodetic telescopes, was performed. The axis offset corrections
derived from this analysis are given in Table 3, also
including antenna types and a priori values for completeness. The results
in Table 3 show that the estimated corrections are not
significant for six of the telescopes, confirming the previous indication
that parameter uncertainties derived from our analysis appears to be
realistic. For Jodrell Bank, however, a correction significant at the
3-sigma level (
–0.19 ± 0.06 m) is found. It is not yet understood
whether this correction might be real or whether it is an artefact from
our data. When estimating this parameter, the X and Z coordinates of
Jodrell Bank shift by 15 to 20 cm, which is larger than the uncertainties
given in Table 1. These coordinates are thus subject to caution
(at such a level of accuracy) until the origin of the axis offset correction
is understood.
Table 3:
Antenna types, a priori axis offsets and estimated corrections.
| Telescope |
Antenna
type |
Axis offset
(m) |
Correction
(m) |
|
|
| Effelsberg |
AZEL |
0.00 |
0.01 ± 0.02 |
| Jodrell Bank |
AZEL |
0.458 |
–0.19 ± 0.06 |
| Medicina |
AZEL |
1.83 |
–0.01 ± 0.03 |
| Noto |
AZEL |
1.83 |
0.00 ± 0.02 |
| Onsala85 |
EQU |
2.15 |
0.01 ± 0.01 |
| Torun |
AZEL |
0.00 |
–0.02 ± 0.06 |
| Westerbork |
EQU |
4.95 |
0.02 ± 0.02 |
AZEL = azimuth-elevation mount,
EQU = equatorial mount
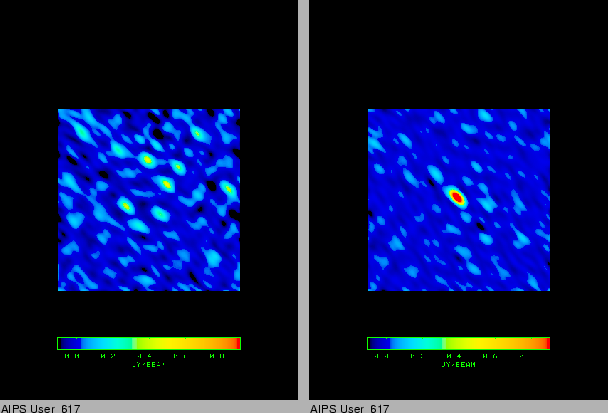
Figure 3:
Phase-referenced maps of J1635+380 using 3C345 as phase calibrator.
Left: image made using the original telescope coordinates. Peak flux is
0.49 Jy/beam.
Right: image made using the newly-derived telescope
coordinates in Table
1. Peak flux is 1.55 Jy/beam. Both images are
plotted with the same color scale, ranging from –0.1 to 0.9 Jy/beam.
|
Finally, a qualitative evaluation of our results was accomplished by comparing
phase-referenced maps made with the original and newly-derived telescope
coordinates. For this comparison, we used data from a 6-cm phase-reference test
experiment consisting of 1-hour of interleaved observations on the close pair
3C345/J1635+380 2.25°).
Figure 3 shows
the maps of J1635+3808 for the two cases. The problems with
the phase-reference map using the original telescope positions are evident, as
is the improvement in focusing the flux into the source and the reduction of
the off-source noise when the newly-derived positions are used. This decisive
test validates definitively our estimated telescope positions, and alternately
demonstrates that phase-referencing can only be successful if an accurate
geometrical VLBI model is available.
Based on a non-standard 5 GHz geodetic experiment conducted in November 2000,
improved coordinates of three non-geodetic EVN telescopes have been obtained.
These newly-derived positions are accurate to about 5 cm, a factor of 100
improvement over previous values. Such improved coordinates will be largely
of benefit to VLBI observations with the EVN, especially those conducted with
the phase-referencing technique. The new telescope positions, and others derived
from these via local ties, have been made
available to the EVN users and VLBI correlators that
regularly process data from EVN telescopes. Further investigation will continue,
in particular to determine the as-yet-unidentified origin of the Jodrell Bank
axis offset correction, but also more generally to evaluate the influence of
the ionosphere, troposphere and clock modeling on these results.
We are indebted to a number of people who have indirectly contributed
to the success of this project. Nancy Vandenberg provided us with a version of
SKED that can deal with single-frequency setups and made useful suggestions
regarding the design of this experiment. Chris Jacobs, Chopo Ma and Dave Shaffer
also helped in the initial stages of the experiment design, while Ed Himwich
answered last-minute critical questions. The data were exported to a geodetic data
base file with help from Arno Müskens and Izabela Rottmann. Special thanks are
due to Richard Porcas for stimulating discussions and to Huib Jan van Langevelde
for continued interest in this project. The observations and analysis presented
in this report were carried out for the benefit of the EVN with support from the
European Commission's IHP programme Access to Research Infrastructures under
contract No. HPRI-CT-1999-00045.
-
- 1
- Campbell, J., Nothnagel, A.: 2000, European VLBI for
Crustal Dynamics, J. of Geodynamics, Vol. 30, p. 321.
- 2
- Beasley, A. J., Conway, J. E.: 1995, VLBI Phase-Referencing,
Very Long baseline Interferometry and the VLBA, J. A. Zensus, P. J. Diamond,
and P. J. Napier (eds.), ASP Conf. Ser., Vol. 82, p. 327.
- 3
- Ma, C., Arias, E. F., Eubanks, T. M., Fey, A. L., Gontier,
A.-M., Jacobs, C. S., Sovers, O. J., Archinal, B. A., Charlot, P.: 1998, The
International Celestial Reference Frame as Realized by Very Long Baseline
Interferometry, AJ, 116, 516.
- 4
- Sovers, O. J., Jacobs, C. S.: 1996, Observation Model
and Parameter Partials for the JPL VLBI Parameter Estimation Software
``MODEST''-1996, JPL Publication 83-39, Rev. 6, August 1996.
- 5
- Lundqvist, G.: 1982, Precision Surveying at the 1-mm level
using radio interferometry, Proceedings of Symposium No. 5-IAG, NOAA
Technical Report NOS 95 NGS 24, p. 99.
- 6
- Niell, A. E.: 1996, Global mapping functions for the
atmosphere delay at radio wavelengths, JGR, 101, 3227.
- 7
- Daniell, R. E., Brown, L. D., Anderson, D. N., Fox, M. W.,
Doherty, P. H., Decker, D. T., Sojka, J. J., Schunk, R. W.: 1995,
Parameterized ionospheric model: A global ionospheric parameterization
based on first principles models, Radio Sci, 30, 1499.
- 8
- Campbell, R. M.: 1999, Ionospheric corrections via PIM and
real-time data, New Astronomy Reviews, 43, 617.
Footnotes
- ... telescopes
- see the list of telescopes at
www.jive.nl/jive/evn/network/network.html
- ... ITRF2000
- ITRF2000 coordinates are available at
lareg.ensg.ign.fr/ITRF/
- ... C04
- IERS combined Earth orientation parameters are
available at
hpiers.obspm.fr/eop-pc/
- ... users
- a recipe for incorporating station coordinate
improvements into AIPS analysis of already-correlated data is also available at
www.jive.nl/jive/evn/user_guide/stapos.html
![\includegraphics[bb=160 303 469 545,width=14cm,clip]{p197.ps}](Charlot-img3.png)