See similar pages for the sessions 3/2008, 1/2009, 2/2009, 3/2009 and 1/2010


Amplitude Calibration at Tr
in EVN Session 2/2010


Kaz Borkowski (June 16, 2010)


Diode Temperature Calibration

(Results of some CL-type experiments
and final rxg data)


The presented data are being derived nonstandard way. Because of problems described in this report normally we cannot use the otherwise very convenient EVN standard application of GNPLT. Instead, to arrive at Tcal values we analyse the calibration (CL) logs with a FORTRAN program, specially developed for the purpose, that employs weighted averaging (also described in the above mentioned report) of original calibration data provided in the logs in the form of the onoff measurements. See also comments on this session in a Report to TOG Meeting (a doc file).


C-band measurements


Methanol-band measurements


L-band measurements


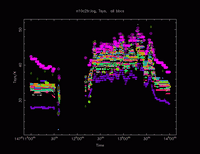
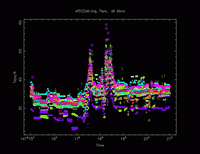
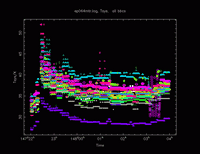
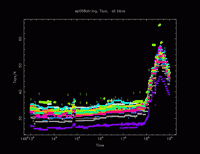
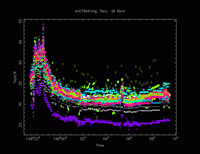
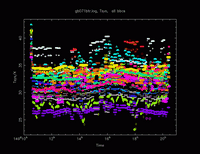
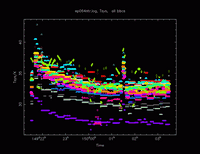
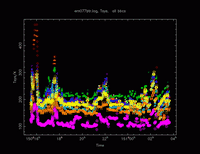
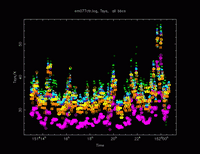
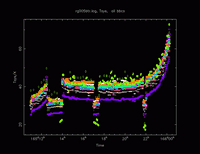
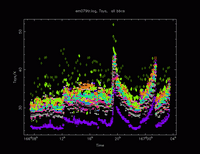
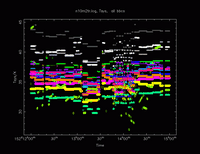
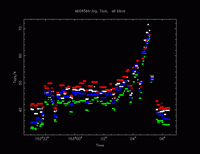
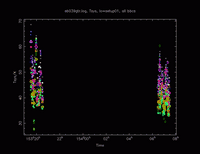
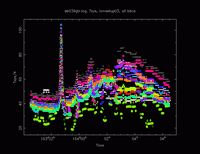
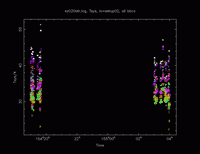
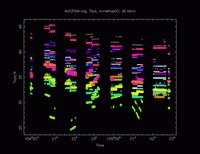
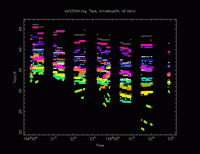
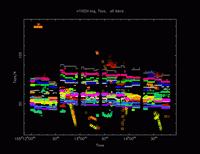
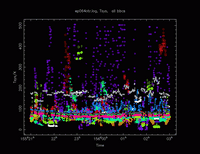
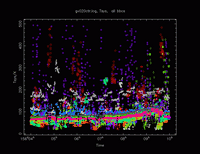
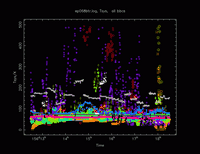
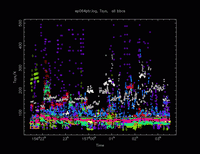
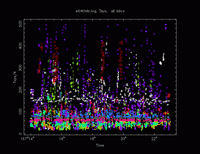
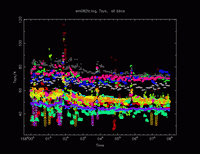
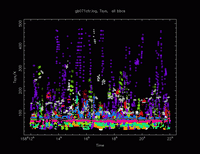
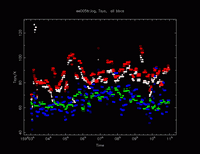
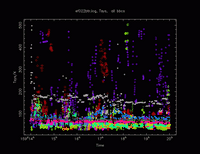
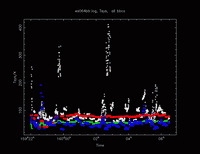
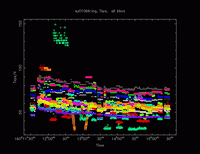
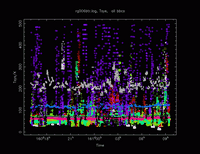
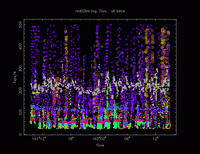
System Temperature at Tr Station
as produced with the antabfs.pl tool

(Click on an image to see it in full resolution)


C-Band Experiments


n10c2-Tsys.gif
n10c2
ef022a-Tsys.gif
ef022a
ep064m-Tsys.gif
ep064m
ep068a-Tsys.gif
ep068a

ev018a-Tsys.gif
ev018a
gb071b-Tsys.gif
gb071b
ep064n-Tsys.gif
ep064n
em077b-Tsys.gif
em077b

em077c-Tsys.gif
em077c
rg005b-Tsys.gif
rg005b
em079-Tsys.gif
em079


Methanol-Band Experiments


n10m2-Tsys.gif
n10m2
eb045b-Tsys.gif
eb045b
eb039gSetuo01-Tsy.gif
eb039gSetuo03-Tsy.gif

ez20aSetup02-Tsys.gif
ez20aSetup02
ez20aSetup03-Tsys.gif
ez20aSetup03
ez20aSetup04-Tsys.gif
ez20aSetup04


L-Band Experiments


n10l2-Tsys.gif
n10l2
ep064o-Tsys.gif
ep064o
gv020c-Tsys.gif
gv020c
ep068b-Tsys.gif
ep068b

ep064p-Tsys.gif
ep064p
el040a-Tsys.gif
el040a
em082-Tsys.gif
em082
gb071c-Tsys.gif
gb071c

ee005-Tsys.gif
ee005
ef022b-Tsys.gif
ef022b
es064b-Tsys.gif
es064b
ey010b-Tsys.gif
ey010b

rg006b-Tsys.gif
rg006b
rsd02b-Tsys.gif
rsd02b (with some details)


Created with the help of IrfanView and Easy Thumbnails
Last modified: June 16, 2010