Available are also similar pages for some earlier sessions:
3/2008,
1/2009,
2/2009,
3/2009,
1/2010,
2/2010,
3/2010,
1/2011,
2/2011
and 3/2011
Amplitude Calibration at Tr
in EVN Session 1/2012
Kaz Borkowski (March 9, 20121)
See also the 'Torun' entries for each experiment observed in the
session feedback.
A collection of detailed station specific schedules for this session can be found in
this
pdf file (515 kB).
Diode Temperature Calibration
(Results of some CL-type experiments
and final rxg data)
The calibration data (Tcal) presented below are being derived nonstandard way. Because of
problems described in this report normally
we cannot use the otherwise very convenient EVN standard application of GNPLT
(the name standing for Gain Plot).
Instead, to arrive at Tcal values we analyse the calibration (cl) experiment logs with
a FORTRAN program, specially developed
for the purpose, that employs weighted averaging
(also described in the above mentioned report) of original calibration data
provided in the logs in the form of onoff
measurements.
|
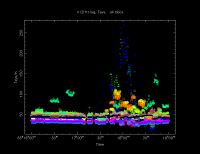
Methanol-band measurements


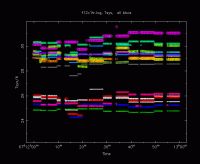
L-band measurements


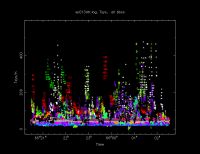
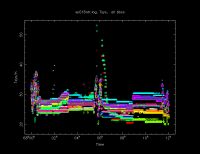
C-band measurements


|
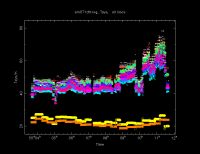
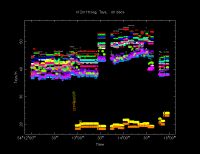
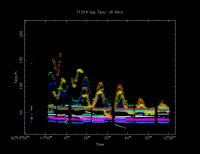
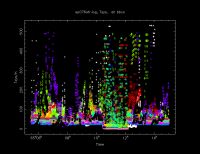
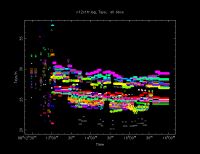
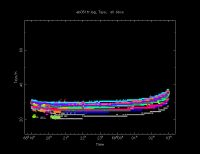
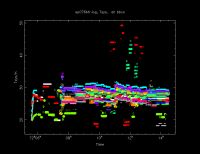
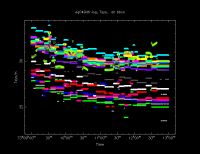
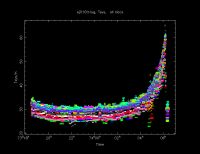
System Temperature at Tr Station
as produced with the antabfs.pl tool
(Click on an image to see it in a higher resolution)
Methanol-Band Experiments
L-Band Experiments
C-Band Experiments
Created with the help of IrfanView
Last revised: March 14, 2012