Available are also similar pages for some earlier sessions:
3/2008, 1/2009, 2/2009, 3/2009, 1/2010, 2/2010, 3/2010, 1/2011, 2/2011, 3/2011, 1/2012, 2/2012 and 3/2012


Amplitude Calibration at Tr
in EVN Session 1/2013


Kaz Borkowski (March 26, 2013)


See also the 'Torun' entries for each experiment observed in the session feedback.
A collection of detailed station specific schedules for this session can be found in this pdf file (875 kB).


Diode Temperature Calibration

(Results of some CL-type experiments
and final rxg data)


The calibration data (Tcal) presented below are being derived nonstandard way. Because of problems described in this report normally we cannot use the otherwise very convenient EVN standard application of GNPLT (the name standing for Gain Plot). Instead, to arrive at Tcal values we analyse the calibration (cl) experiment logs with a FORTRAN program, specially developed for the purpose, that employs weighted averaging (also described in the above mentioned report) of original calibration data provided in the logs in the form of onoff measurements.


C-band measurements


K-band measurements

A. Gain curve as determined from odservations of Jupiter

B. Tcal determined earlier at good weather

C. Tcal from CL experiments during this session
(rxg data are just rescaled January determinations on Jupiter presented on the plots above)


Methanol-band measurements


L-band measurements


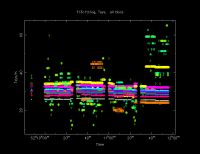
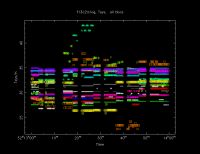
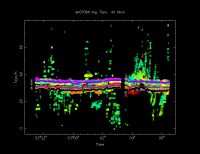
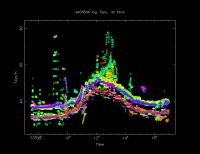
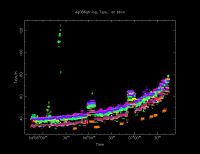
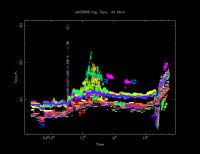
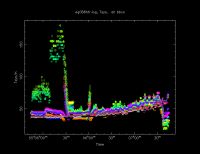
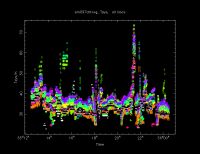
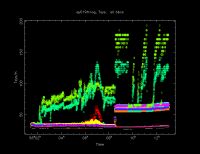
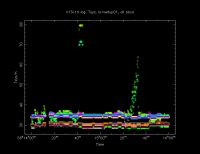
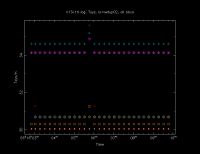
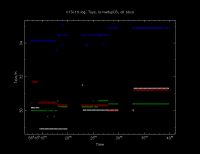
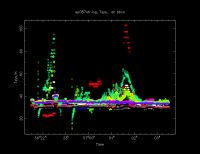
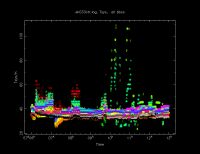
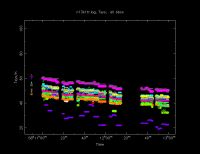
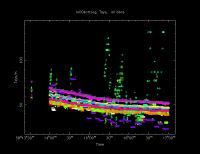
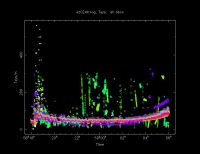
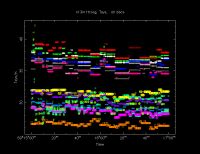
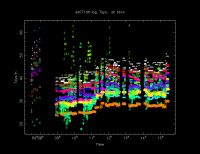
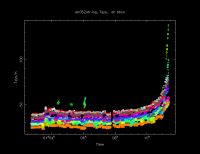
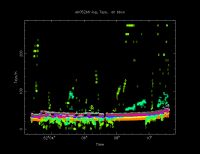
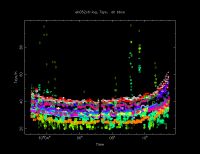
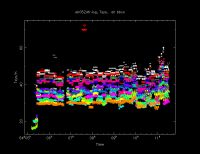
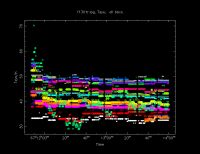
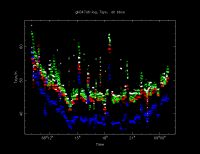
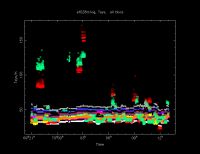
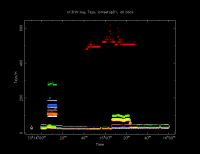
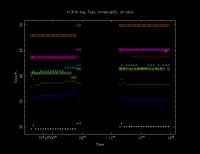
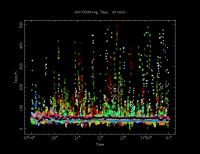
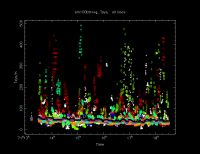
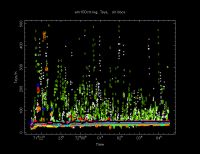
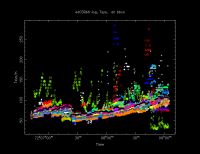
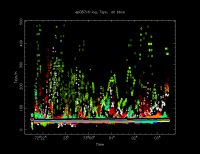
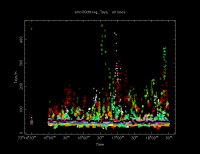
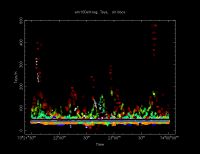
System Temperature at Tr Station
as produced with the antabfs.pl tool

(Click on an image to see it in a higher resolution)


C-Band Experiments


f13c1-Tsys.png
f13c1

f13c2-Tsys.png
f13c2

ek033b-Tsys.png
ek033b

es068a-Tsys.png
es068a

eg066g-Tsys.png
eg066g

es068b-Tsys.png
es068b

eg066h-Tsys.png
eg066h

em097a-Tsys.png
em097a

ey019-Tsys.png
ey019

n13c1-TsysSetup01.png
n13c1 setup1

n13c1-TsysSetup02.png
n13c1 setup2

n13c1-TsysSetup03.png
n13c1 setup3

ep087a-Tsys.png
ep087a

ek033c-Tsys.png
ek033c


K-Band Experiments


n13k1-Tsys.png
n13k1

ro004c-Tsys.png
ro004c

ez024-Tsys.png
ez024


Methanol-Band Experiments


n13m1-Tsys.png
n13m1

es071a-Tsys.png
es071a

eb052a-Tsys.png
eb052a

eb052b-Tsys.png
eb052b

eb052c-Tsys.png
eb052c

eb052d-Tsys.png
eb052d


L-Band Experiments


f13l1-Tsys.png
f13l1

gk047a-Tsys.png
gk047a

et028-Tsys.png
et028

n13l1-Tsys setup1.png
n13l1 setup1

n13l1-Tsys setup2.png
n13l1 setup2

em100a-Tsys.png
em100a

em100b-Tsys.png
em100b

em100c-Tsys.png
em100c

ed039b-Tsys.png
ed039b

ep087c-Tsys.png
ep087c

em100d-Tsys.png
em100d

em100e-Tsys.png
em100e


Created with the help of IrfanView
Last revised: March 26, 2013