
Data from the station taken before and after replacement (M2011080.dat file). The new unit begun
operating at 9:16 UTC, and the mast was lifted to its upright position at about 11:00 UTC
TCfA Meteo Data 2000 to 2012
This is an update to an earlier report.
Table of Contents
Because of malfunctioning of the humidity sensor, on 21 March 2011 the station was dismounted and sent to the manufacturer (at the time of writing it is still there). A station of the same type was installed as a temporary replacement. Data taken during this day are suggestive that the other sensors of the old unit worked smoothly continuously since more than 10 years! However, our wind velocity sensor seems to have its zero level slightly (by about 0.5 m/s) offset (see the last year worth of these data). Moreover, our earlier study indicated also a different (compressed, diminished) scale as compared to Koniczynka measurements.
|
Data from the station taken before and after replacement (M2011080.dat file). The new unit begun operating at 9:16 UTC, and the mast was lifted to its upright position at about 11:00 UTC |
These were all calculated from daily averages. Below there are four tables with the first character designating the type of meteo data: T – air temperature (in degrees Centigrade), P – atmospheric pressure (hPa), H – relative humidity (%), and V – wind speed (m/s). A line beginning with a number contains averages of so numbered month for years given in the top line. The last line in each table (marked 'Av') gives the yearly mean.
T 2000 2001 2002 2003 2004 2005 2006 2007 2008 2009 2010 2011 2012 1 - 0.16 0.63 -1.93 -4.40 1.65 -7.30 4.11 1.63 -2.31 -7.37 0.27 -0.91 2 - -3.60 4.04 -3.35 0.86 -1.63 -1.74 -0.45 4.21 0.54 -1.60 -3.84 -4.15 3 - 3.19 5.11 2.78 4.38 0.93 -0.40 6.74 4.20 3.17 3.97 3.43 4.16 4 - 8.65 8.94 7.76 9.04 9.04 8.78 9.81 8.94 11.61 8.70 10.69 - 5 - 13.71 17.51 15.61 12.33 13.66 13.86 15.20 14.20 13.54 12.42 14.30 - 6 - 15.35 17.41 18.22 16.04 15.96 17.87 18.93 18.10 15.65 16.80 18.07 - 7 17.29 20.20 20.07 19.62 17.72 20.33 23.08 18.73 19.65 19.38 21.87 17.70 - 8 18.45 19.63 21.45 19.22 19.39 17.81 19.27 19.15 18.53 19.28 19.47 18.35 - 9 12.80 12.45 14.38 15.02 14.53 16.77 16.99 13.84 13.21 15.65 13.04 15.22 - 10 12.06 11.58 7.60 5.80 10.25 10.11 11.46 8.91 9.36 7.18 6.95 9.22 - 11 6.41 2.59 3.94 5.35 3.81 3.64 6.62 2.43 5.23 6.22 5.03 3.43 - 12 -0.71 -2.47 -4.96 1.78 2.26 0.31 5.01 1.38 1.03 -0.66 -5.69 2.82 - Av 10.96 9.51 9.71 9.03 8.91 9.11 8.74 9.97 9.88 9.28 7.74 9.22 -0.82 P 2000 2001 2002 2003 2004 2005 2006 2007 2008 2009 2010 2011 2012 1 - 1005.01 1009.40 1002.01 998.26 1002.33 1017.48 996.71 1005.36 1004.79 1007.68 1005.73 1007.67 2 - 997.91 998.16 1014.01 1003.49 1005.40 1002.66 1001.08 1009.58 997.80 996.31 1009.09 1014.28 3 - 999.98 1005.01 1011.22 1008.34 1003.50 999.68 1003.87 991.98 999.40 1002.44 1010.52 1015.80 4 - 1002.27 1006.57 1005.10 1003.55 1004.39 1001.13 1007.85 999.26 1006.13 1006.46 1006.10 - 5 - 1006.27 1003.62 1006.06 1000.97 1003.36 1002.90 998.80 1005.83 1006.37 999.30 1009.27 - 6 - 1003.33 1004.72 1003.84 1002.44 1004.38 1007.64 1000.00 1003.19 1001.59 1001.18 1006.17 - 7 1008.71 1003.98 1003.52 1003.16 1003.33 1001.38 1007.55 998.11 1002.32 1001.16 1003.48 1001.18 - 8 1009.12 1006.06 1003.64 1003.68 1001.76 1003.60 996.43 1002.15 1000.03 1005.69 1000.15 1006.03 - 9 1009.45 1000.19 1006.66 1008.31 1005.61 1007.48 1005.49 1003.43 1006.18 1007.58 1003.00 1008.21 - 10 1007.56 1007.82 1000.52 1000.83 1003.08 1011.76 1002.87 1011.36 1003.16 1003.67 1006.12 1011.82 - 11 1002.66 1004.36 1001.01 1008.02 1004.28 1005.45 1001.86 1001.50 1000.26 998.82 994.26 1016.20 - 12 1003.10 1008.69 1012.75 1004.23 1004.66 1001.66 1009.68 1010.10 1007.98 999.11 999.66 1000.83 - Av 1006.72 1004.25 1004.68 1005.68 1003.30 1004.54 1005.28 1002.93 1002.89 1002.79 1001.72 1007.57 1012.04 H 2000 2001 2002 2003 2004 2005 2006 2007 2008 2009 2010 2011 2012 1 - 95.69 95.19 97.56 97.44 96.28 96.72 98.03 98.89 99.02 94.94 99.55 91.26 2 - 89.65 90.77 93.55 92.15 92.25 98.53 95.05 97.09 99.23 97.30 90.04 86.58 3 - 89.81 84.03 83.05 89.63 89.89 92.40 89.13 94.14 96.84 89.59 74.17 79.97 4 - 84.25 77.73 75.61 78.61 77.27 82.80 76.06 89.45 71.98 78.95 64.66 - 5 - 74.90 74.33 77.25 82.64 82.46 79.31 85.67 81.12 85.23 92.51 65.69 - 6 - 83.36 80.41 72.66 80.35 81.64 82.83 86.23 73.79 94.61 83.25 68.78 - 7 83.86 82.68 80.33 87.21 83.82 76.94 69.92 87.44 81.31 87.68 73.40 83.14 - 8 75.53 79.51 75.11 76.01 81.01 78.78 91.60 86.82 88.75 66.72 83.11 75.58 - 9 81.70 93.00 85.65 80.09 83.44 79.40 88.32 92.11 96.51 79.90 89.72 76.77 - 10 87.36 92.36 95.08 93.64 93.00 88.85 95.80 96.89 98.35 95.99 81.96 84.20 - 11 97.35 95.28 96.30 98.76 97.54 97.98 98.77 99.30 99.71 97.55 99.24 92.50 - 12 97.76 96.62 97.14 95.78 99.19 99.87 99.74 99.90 99.89 99.89 99.02 91.50 - Av 87.05 87.72 85.98 85.98 88.23 86.79 89.42 91.05 91.51 89.35 88.58 80.52 86.79 V 2000 2001 2002 2003 2004 2005 2006 2007 2008 2009 2010 2011 2012 1 - 4.07 4.90 4.11 4.27 4.79 3.57 5.72 5.03 3.42 4.28 3.64 3.71 2 - 4.43 5.23 3.65 4.26 4.56 4.14 4.91 4.55 4.13 3.93 4.48 3.30 3 - 4.33 5.06 3.63 4.85 4.29 3.64 4.35 4.38 4.65 4.02 4.01 3.69 4 - 4.30 4.35 5.24 4.16 3.84 3.86 4.30 3.89 3.98 4.08 4.33 - 5 - 4.30 4.07 3.80 4.09 3.92 4.21 3.80 3.85 3.98 3.89 3.70 - 6 - 3.29 4.21 3.74 3.86 3.94 3.55 3.79 3.71 4.29 3.67 3.60 - 7 4.16 4.04 4.11 3.38 3.61 3.73 3.77 3.90 3.83 3.38 3.58 3.60 - 8 3.47 3.83 3.72 3.53 3.72 3.64 4.04 3.78 4.23 3.64 3.64 3.23 - 9 3.89 3.84 3.63 3.43 3.87 3.42 3.84 4.43 3.87 3.61 4.24 3.14 - 10 4.04 3.66 4.37 3.65 4.13 3.87 3.94 3.58 3.87 3.91 4.22 3.33 - 11 4.07 4.34 4.21 3.97 4.35 3.76 4.31 4.23 4.88 4.78 4.15 2.94 - 12 3.23 4.41 3.70 4.82 4.14 4.45 4.50 4.02 3.74 3.76 4.35 4.24 - Av 3.81 4.04 4.29 3.92 4.11 4.02 3.93 4.23 4.16 3.95 4.01 3.68 3.56 |
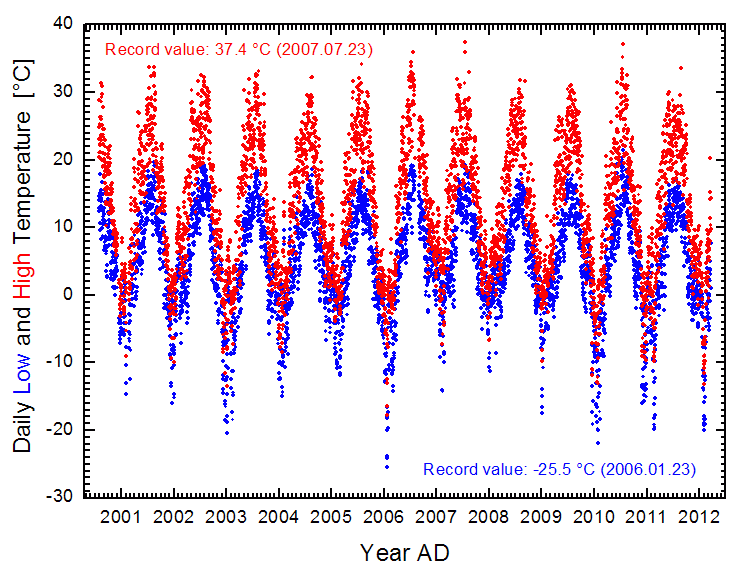
Below presented are high and low values of the four main quantities for each day till 21 March 2012.
 |
 |
 |
 |
The plots that follow have these widths of bins (horizontal resolutions):
 |
 |
 |
 |
 |
Rermembering the peculiar pattern of wind direction we took the chance of the station unit replacement on 21 March 2011 to rotate the 'cage' built around the station. Before lifting up of the mast pole the cage was rotated by about 60 degrees. It was expected it will appreciably affect the pattern, however, one year worth of data (22 March 2011 to 21 March 2012 as compared to data of 21 March 2010 to 20 March 2011) shows no significant change that could be attributed to the rotation. Essentially, all the peaks in this pattern are seen in both the distributions (matching also the 2000 to 2012 pattern).
 Distribution of wind direction data from the station taken over the spans of one year before and one year after rotation of the cage by 60 degrees around the vertical. The counts correspond to 1 degree wide divisions centered at integer degrees; the 0th bin count corresponds to the range from -0.5 (or 359.5) to +0.5 degrees. Note the absence of the depression near 0 degrees seen in the older data (before 5 June 2008) and being due to wrong averaging of this angular quantity. |
The planned 90-metre radio telescope is to be built in the commune of Osie (see also a map of probable location – Dębowiec to the North of Osie) in the Pomerania region. It is important for the working and safety of the telescope to know climatic conditions in the region. The meteo station with regular patrol nearest to the site is in Chojnice, about 57 km west of Osie. Here are some daily measurements in that station presented in graphical form. The data used were taken from TuTiempo.net collection.
 |
 |
 |
To assess reliability of the Chojnice wind velocity data here follow annual
averages from a few Pomerania meteo stations sourced mostly from
here.
Since this internet site seems to not work correctly for a few years (e.g. 2005),
three missed Chojnice averages were replaced with means obtained from monthly
data avalable under already mentioned
address.
 |
Judging from the above diagram it is difficult to avoid the conclusion that
all these wind velocity measurements are not very reliable. Assuming our
(Piwnice) data are systematically underestimated for stronger winds (say stronger
than some 4 m/s) and overestimated for weaker winds (as
this figure would suggest), and noting that
the median value of our individual measurements is about 3.85 m/s, the Chojnice data
seem somewhat underestimated (not speaking of the Toruń and Koszalin data, represented
by the two lowest curves in this diagram).